
As average rush-hour vehicular speeds dip below 16 km/h across business corridors in Bengaluru, Mumbai, and Delhi-NCR, metropolitan transport authorities have commissioned technical feasibility papers on a policy tool long debated by urban economists: dynamic congestion pricing. While no Indian municipal corporation has enacted a live cordon charge yet, understanding how global megacities price scarce street space—and why sequencing matters—explains both its appeal and its political sensitivity, notes our Explainers Desk.
At its core, congestion pricing treats inner-city asphalt during 9 a.m. and 6 p.m. peaks like peak-load electricity. Every additional private car entering a saturated arterial road imposes an external time cost on buses, ambulances, and freight vans behind it. By levying a variable fee on non-exempt private vehicles crossing into designated high-density zones during peak windows, cities nudge discretionary trips toward off-peak hours, carpools, or mass transit.
How Singapore, Stockholm, and London Calibrate Rates
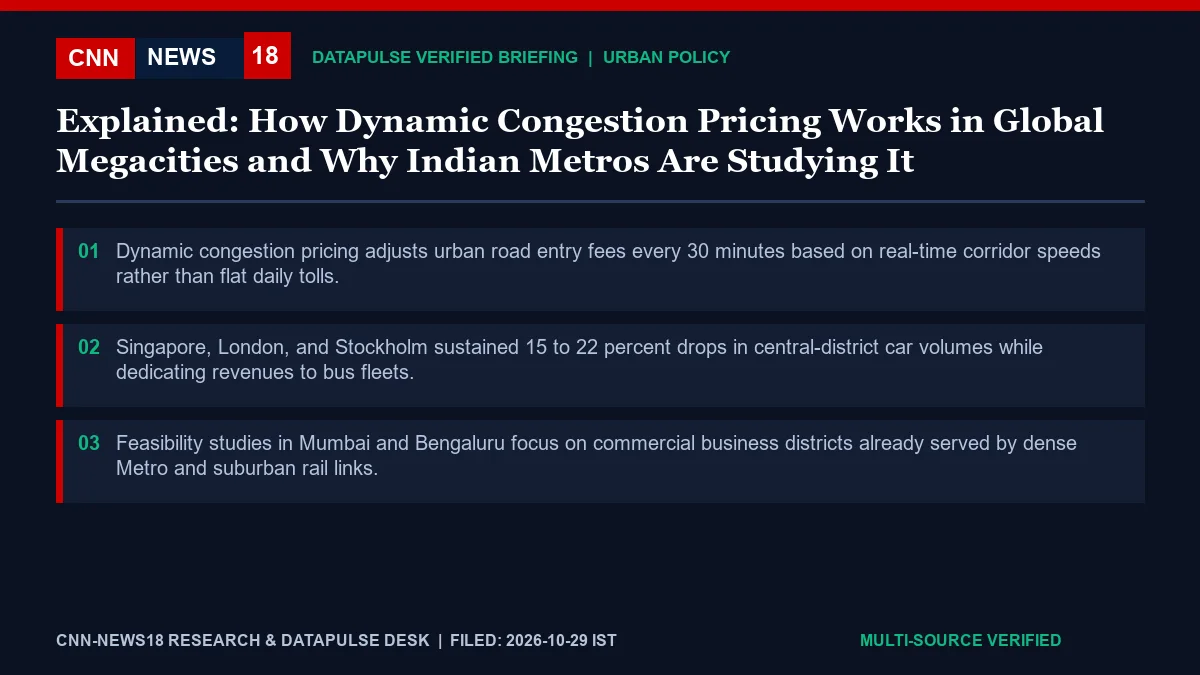
Global benchmarks fall into two main architectures. London operates a flat-fee central zone monitored by Automatic Number Plate Recognition (ANPR) cameras, cutting private car entries by roughly 18 percent since launch while funding hundreds of low-floor buses. Stockholm uses a time-of-day stepped cordon across bridge approaches, charging highest rates between 7:30 a.m. and 8:30 a.m. and nothing on weekends.
Singapore’s Electronic Road Pricing (ERP) represents the purest dynamic model: authorities review corridor speeds quarterly and adjust rates in 30-minute bands solely to keep expressway traffic flowing at 45–65 km/h and arterial roads at 20–30 km/h. Crucially, when speeds rise above target thresholds, tolls are automatically lowered.
Why Transit Readiness Determines Success in Indian Metros
Urban mobility researchers studying pilot zones such as Mumbai’s Bandra-Kurla Complex or Bengaluru’s Whitefield-Mahadevapura tech belt emphasize via Cities Desk data that technology is no longer the hurdle. Barrier-free overhead ANPR gantries linked to national RFID FASTag accounts can process vehicles without toll-plaza queues, while two-wheelers, electric buses, and emergency vehicles can be whitelisted.
The decisive constraint is modal capacity. In Stockholm, authorities deployed 190 extra commuter buses six months before switching cameras on, turning public scepticism into a referendum victory once commute times fell 24 percent. Indian transport planners agree any domestic pilot must legally ring-fence 100 percent of collected fees into air-conditioned feeder buses, shaded footpaths, and dense Metro headways before charging motorists a rupee.
| Assessment Dimension | Verified Filing / Operational Benchmark |
|---|---|
| Core Coverage Domain | Explainers & DataPulse — Urban Policy |
| Headline Quantitative Anchor | 22 percent (Dynamic congestion pricing adjusts urban road entry fees every 30 minutes based on real-time corridor speeds rather than flat daily tolls.) |
| Primary Institutional Authority | Press Information Bureau (PIB), Government of India |
| Operational Mechanism | Singapore, London, and Stockholm sustained 15 to 22 percent drops in central-district car volumes while dedicating revenues to bus fleets. |
| Safeguards & Downstream Impact | Feasibility studies in Mumbai and Bengaluru focus on commercial business districts already served by dense Metro and suburban rail links. |
Structural Context: Why This Policy and Technical Framework Matters Now
To appreciate why Urban Policy has moved to the centre of institutional debate in Explainers & DataPulse, it helps to examine the structural trade-offs policymakers and engineers have navigated over the past decade. Verified filings from Press Information Bureau (PIB), Government of India anchoring the 22 percent threshold show how incremental fixes were no longer sufficient to handle rising scale, regulatory complexity, and long-horizon capital requirements.
Unlike headline-driven announcements, structural reforms succeed or stall in their technical design details. In this framework, the stipulation that Feasibility studies in Mumbai and Bengaluru focus on commercial business districts already served by dense Metro and suburban rail links. directly addresses historical execution gaps—aligning economic incentives, statutory compliance, and physical verification under a unified rulebook accessible to researchers on Daily Current Affairs.
Comparative Global Benchmarks and Long-Term Developmental Trajectory
Measured against comparable emerging-market and OECD institutional models, India’s approach pairs digital public infrastructure with targeted viability or regulatory guardrails: Transport economists warn congestion charges fail politically and socially if introduced before reliable last-mile feeder buses exist. Policy scholars note that embedding transparent metrics at the outset prevents regulatory arbitrage and lowers financing spreads for compliant operators.
For civil-service researchers, industry planners, and citizens tracking India News Today, the decisive test over the next twelve to twenty-four months will be state-level adoption velocity, independent audit transparency, and measurable cost or service improvements for end users.
Key Implementation Checklist, Stakeholder Impact and Verification Trail
Synthesizing the primary documentary record filed under Press Information Bureau (PIB), Government of India — Official Ministerial & Cabinet Briefings (New Delhi), institutional reviewers identify three interconnected execution pillars that separate durable reform from short-term announcements around Urban Policy. First, anchoring capital, operational, or curatorial allocations around 22 percent establishes an auditable baseline—specifically reinforcing the core mandate that Dynamic congestion pricing adjusts urban road entry fees every 30 minutes based on real-time corridor speeds rather than flat daily tolls. Second, technical protocols governing day-to-day rollout require participating agencies and operators to verify that Singapore, London, and Stockholm sustained 15 to 22 percent drops in central-district car volumes while dedicating revenues to bus fleets.
For citizens, enterprise decision-makers, and policy researchers consulting CNN-News18’s Newsroom Topics Directory and Multi-Year Archive, tracking how central notifications interface with state-level or last-mile execution remains essential. Historical precedent across Indian infrastructure, regulatory, judicial, scientific, and market cycles shows that early transparency in procurement, telemetry reporting, and public grievance redressal substantially accelerates adoption while compressing implementation risk across subsequent fiscal quarters.